


By Maroun Younes, Portfolio Manager, Fidelity Global Future Leaders strategies
There’s never a dull moment in equity markets, and 2025 has already distinguished itself. We’ve seen the long-awaited ceasefire in Gaza. An announcement of tariffs on Canada and Mexico, only to see them suspended. Tariffs on China announced and then countered by China. And investors won’t forget the ripples caused by DeepSeek, challenging some accepted notions around AI, casually wiping out around US$700b in market value off Nvidia in the process[1]. This is just the tip of the iceberg, all before the end of January.
With all this noise, global investors might be wondering what’s next? While we can’t predict the future, I’ll share how I’m viewing the market and the key challenges and opportunities that lie ahead.
Batting averages suggest it’s time to reset expectations
Off the back of two big years – the S&P 500 Index up more than 60% on a cumulative basis over 2023 and 2024 – investors should be mindful this was a relatively rare investing phenomenon.
In fact, in the last 95 years (1,140 months since December 1929), there’s only been 56 monthly instances where the previous 24 months delivered cumulative returns greater than 60%[2]. In other words, 5% of the time in 95 years. Bear in mind 18 of those 56 occurred during the dotcom bull market, between 1996 and 1999.
When we look at those occasions with returns greater than 60% in the previous 24 months, the average return for the following 12-month period has averaged only 0.08%, basically zero. This is not to say that 2025 is destined to be a disaster. However, based on returns of global markets in the last two years, 2025 might prove lacklustre.
Future expectations indicate a more subdued outlook
Let’s now put some numbers into potential return expectations for global markets for the year ahead, using a framework of assumptions. We can view returns to equity investors as the sum of:
- Changes in earnings per share (EPS), plus
- Changes in the P/E valuation multiple, plus
- Dividend yield
Let’s use this equation with a hypothetical scenario. Let’s take the current 11% EPS growth forecast for the MSCI World Index in 2025[3], with a hypothetical buffer of 3% reduction in earnings (based on historical tendencies for earnings to drift downwards as the year progresses), which gives us an EPS growth number of around 8%. EPS is a key component of the price-to-earnings (P/E) valuation ratio.
I then use an expected current dividend yield of 1.7% for the MSCI World Index and account for changes to the P/E multiple. This is the most volatile, and difficult to predict, as its usually driven by ‘animal spirits’ or investor sentiment, and can also be the most prominent driver of returns. Looking at historical P/E multiples for the MSCI World Index in the chart below, we see a sombre picture.
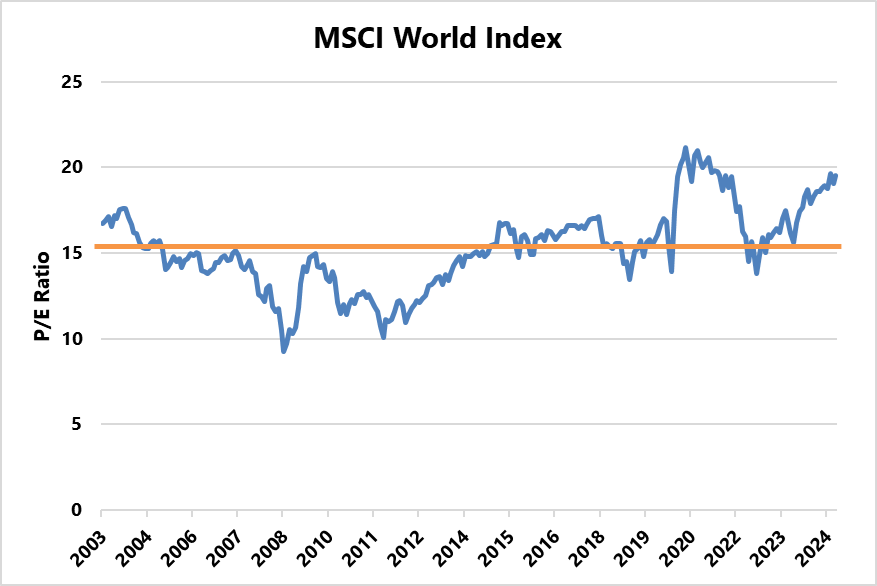
Source: FacSet, FIL
With a P/E ratio of almost 20 (y-axis), the MSCI World Index is currently trading well above its long-term average of just over 15x, and near some of its all-time highs. This creates more downside risk than upside.
With history not on our side, and risks of P/E multiple compression, my lacklustre outlook on returns continues to seem most likely. Therefore, I believe a good ballpark for returns for global investors is somewhere between -10% and +10% for the year – a far cry from the lofty highs of the past two years.
Look beyond the big end of town for opportunity
However, what if there are pockets of the market that appear more attractive than the whole? If I look at the midcap space, and repeat the exercise, I get a different picture:
- Consensus estimates for 2025 EPS growth for the MSCI World Midcap Index are about 12.7%[4]. Again, let’s handicap this number to account for the typical downgrades through the year, and use 9%.
- The dividend yield presently is 1.9%[5].
So, before any changes to P/E valuation multiples, we are hypothetically expecting 11% total returns for the MSCI World Midcap Index for the year. That is slightly higher than the estimated 10% we were sitting at for the MSCI World Index at the same point in the equation.

Source: FactSet, FIL
This is where things get interesting. The chart above shows, the MSCI World Midcap Index is currently trading at almost 17x P/E, comfortably cheaper than the broad cap index. It’s also trading in line with its 30-year historical average, and significantly below its all-time highs. While I’m not going to predict P/E multiples from here, it seems that the midcap index has room to move higher, or alternatively, less room to fall, compared to the broad cap index, priced well above historical averages.
Look beyond the headlines
All things considered, it’s fair to assume that in 2025, global investors may need to reset their expectations and look beyond the mega cap darlings of 2023 and 2024, as we expect 2025 will paint a different picture.
The good news is that beyond the big end of town, we’re still find exciting companies in global small to mid-caps, companies that may not be driving news headlines, but which are far less sensitive to market noise, with plenty of runway for further growth.
Any forward-looking statements, opinions, projections and estimates in this document may be based on market conditions, beliefs, expectations, assumptions, interpretations, circumstances and contingencies which can change without notice, and may not be correct. Any forward-looking statements are provided as a general guide only and there can be no assurance that actual results or outcomes will not be unfavourable, worse than or materially different to those indicated by these forward-looking statements.
All information is current as at 14 February 2025 unless otherwise stated.
This document is issued by FIL Responsible Entity (Australia) Limited ABN 33 148 059 009, AFSL No. 409340 (‘Fidelity Australia’). Fidelity Australia is a member of the FIL Limited group of companies commonly known as Fidelity International. Prior to making any investment decision, investors should consider seeking independent legal, taxation, financial or other relevant professional advice. This document is intended as general information only and has been prepared without taking into account any person’s objectives, financial situation or needs. You should also consider the relevant Product Disclosure Statements (‘PDS’) for any Fidelity Australia product mentioned in this document before making any decision about whether to acquire the product. The PDS can be obtained by contacting Fidelity Australia on 1800 044 922 or by downloading it from our website at www.fidelity.com.au. The relevant Target Market Determination (TMD) is available via www.fidelity.com.au. This document may include general commentary on market activity, sector trends or other broad-based economic or political conditions that should not be taken as investment advice. Information stated about specific securities may change. Any reference to specific securities should not be taken as a recommendation to buy, sell or hold these securities. You should consider these matters and seeking professional advice before acting on any information. Any forward-looking statements, opinions, projections and estimates in this document may be based on market conditions, beliefs, expectations, assumptions, interpretations, circumstances and contingencies which can change without notice, and may not be correct. Any forward-looking statements are provided as a general guide only and there can be no assurance that actual results or outcomes will not be unfavourable, worse than or materially different to those indicated by these forward-looking statements. Any graphs, examples or case studies included are for illustrative purposes only and may be specific to the context and circumstances and based on specific factual and other assumptions. They are not and do not represent forecasts or guides regarding future returns or any other future matters and are not intended to be considered in a broader context. While the information contained in this document has been prepared with reasonable care, to the maximum extent permitted by law, no responsibility or liability is accepted for any errors or omissions or misstatements however caused. Past performance information provided in this document is not a reliable indicator of future performance. The document may not be reproduced, transmitted or otherwise made available without the prior written permission of Fidelity Australia. The issuer of Fidelity’s managed investment schemes is Fidelity Australia.
© 2025 FIL Responsible Entity (Australia) Limited. Fidelity, Fidelity International and the Fidelity International logo and F symbol are trademarks of FIL Limited.
[1] Source: Factset
[2] Source: Bloomberg, FIL
[3] Source: FactSet consensus estimates retrieved on 7th February 2025
[4] Source: FactSet consensus estimates retrieved on 7th February 2025
[5] Source: Factset.


