


By Robert Miller, NAOS Asset Manager
All ASX-listed companies are subject to a range of fundamental obligations, including governance standards, financial and continuous disclosure requirements, as well as operational & reporting requirements. That, after all, is the ‘price of entry’ to be a listed company. One of the privileges of being a listed company is the ability to use equity to incentivise employees, align employees to shareholders, and pay for goods and services given the more readily exchangeable value of listed equity. This use of equity can come in numerous forms, is widely used by companies, and is widely accepted by Mr. Market. The value of this equity is captured under the concept of Share-Based Payments (SBPs).
Share-Based Payments Explained
In simplistic terms, SBPs are a form of payment for goods/services, whereby equity (or rights to equity), through various forms, are issued as an alternative to cash. In terms of their applicability to public equity markets, typically, this is recognised as a form of remuneration for employees of a company.
Common incentive schemes include employee options, performance rights, share appreciation rights (SARs), and employee share purchase plans. These incentive structures often come with vesting conditions, such as required service periods and specific performance conditions (i.e. earnings milestones or share price thresholds).
All SBP schemes have unique advantages, disadvantages, and complexities. We do not intend to discuss these nuances in this article but suffice to say that at the end of the day, the theoretical principle behind these schemes is to align individual employees with a company’s wider performance and its shareholders.
The Realities of Share-Based Payments
When thinking about a company’s earnings, investors often (rightly or wrongly) think about earnings at the EBITDA level, given its close proxy to cash flow. This can be accurate in some instances as it provides a reflection of a company’s earnings at the operating level however, it also opens the possibility of omitting some crucial components which highlight the true earnings of a company.
SBPs can be one of those omissions. Many companies and investors choose to exclude SBPs from EBITDA given their non-cash impact which is plausible. Equally, one could argue that the cost of SBPs is very real, and the value attributed to SBPs is a valid cost, given the ability to settle equity schemes with cash in any event and the notion that there would likely be a material increase in the total cash employment costs paid if not for these equity schemes.
Below is a theoretical example of what many ASX-listed companies would detail in the notes to their annual reports. As you can, SBPs are typically excluded from EBITDA.
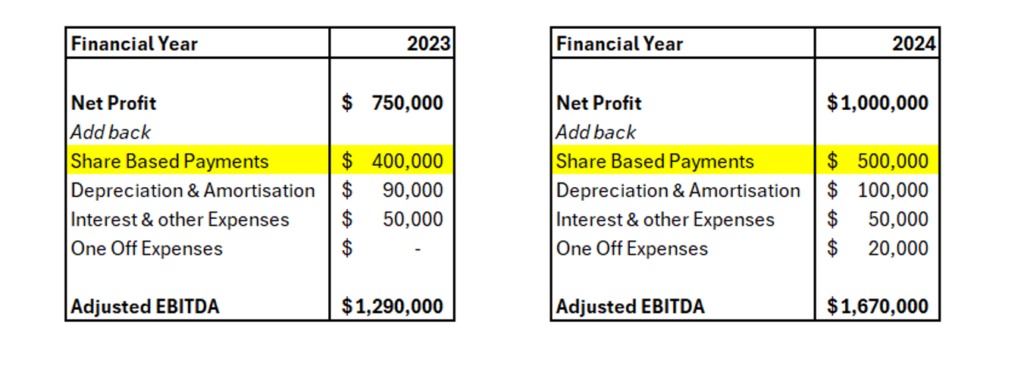
At NAOS we do not solely look at EBITDA. While we consider its relevance for each business, we always look further into the most applicable metrics that provide a better understanding of true earnings, financial health and cash flow.
What is of paramount importance is not looking at headline figures in isolation but rather focusing on per-share metrics to gain a true reflection of the value being added (or not) for shareholders.
Company XYZ (an alias for a real company)
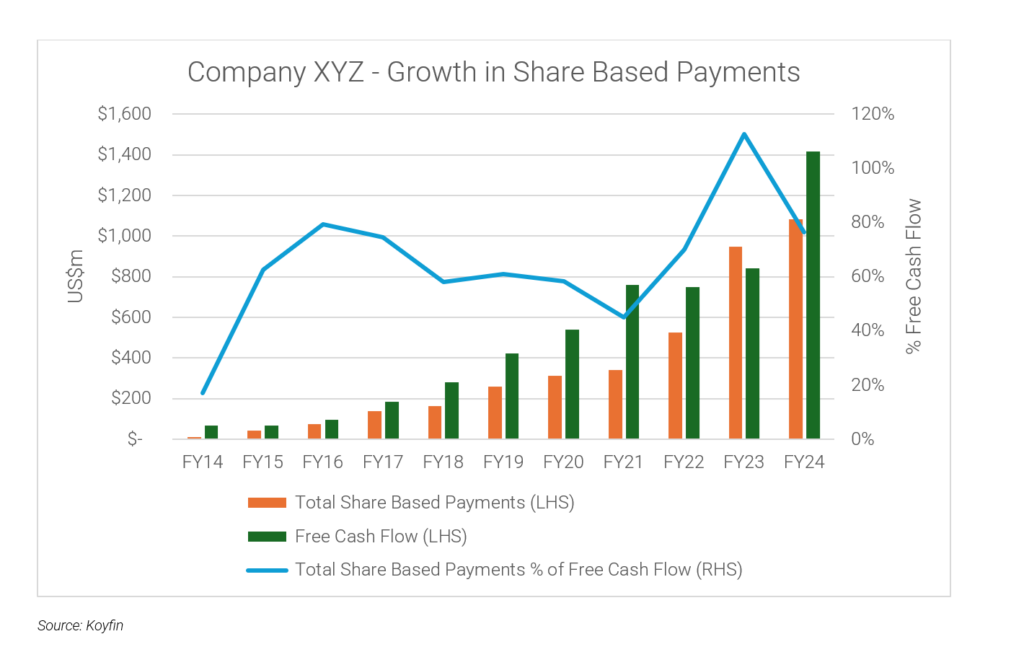
Consider the below example of a highly successful and well-known NASDAQ-listed company (Company XYZ). The success of Company XYZ can be evidenced by a decade of significant free cash flow growth. Equally, there has been a substantial increase in the dollar value of SBPs, exceeding US$1bn in FY24.
If you consider the fact that free cash flow excludes SBP expenses, then hypothetically if all SBPs were treated as an expense and paid in the traditional remuneration form of cash, then free cash flow would fall by ~80%. Furthermore, in FY24 Company XYZ’s operating profit margin was -3% (which considers the full cost of SBPs), however when removing SBPs, its operating profit margin was 22%.
We are not passing judgement on Company XYZ – in fact, we believe it is a good business with an ever-increasing number of customers. However, we use this example to point out the significant variances in metrics depending on how SBPs are treated – a common approach among listed companies.
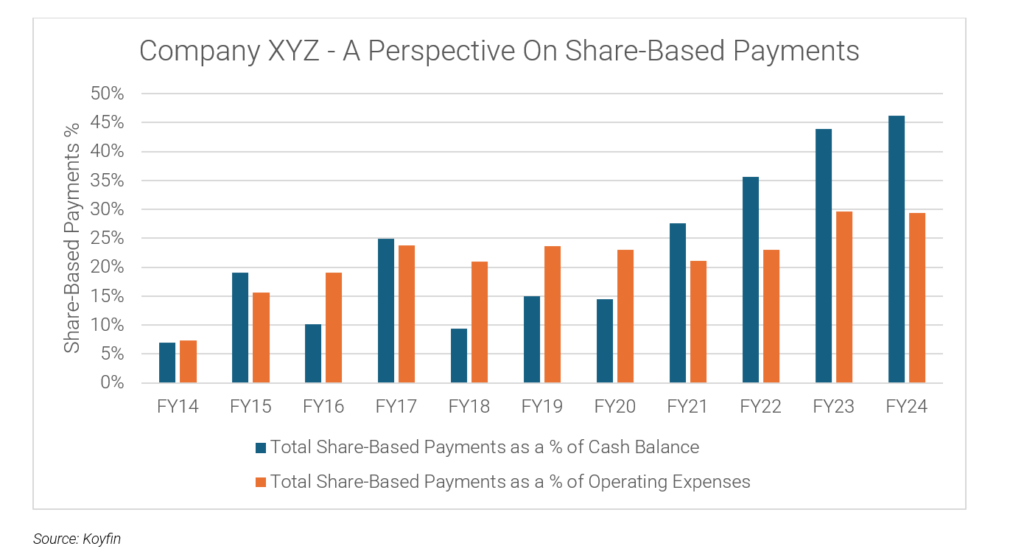
Perhaps we are being slightly unrealistic here because if all SBPs were swapped for a more standard cash remuneration, then the expense base of Company XYZ may be structured differently. Paying for the abovementioned expenses entirely in cash would reduce the company cash balance significantly (by ~US$1bn only using the figure for FY24). A lower cash balance may impact how Company XYZ is managed. For example, if all SBPs were paid in cash, then perhaps the ability to reinvest in future growth areas would reduce, which would impact future revenue growth. If it weren’t for the ever-increasing issuance of SBPs to employees, then we hold doubts that Company XYZ would have achieved the same level of revenue growth. As you can see from the chart below, SBPs are a very material component of Company XYZ’s ‘true cost base’.
Looking at the ASX & NZX
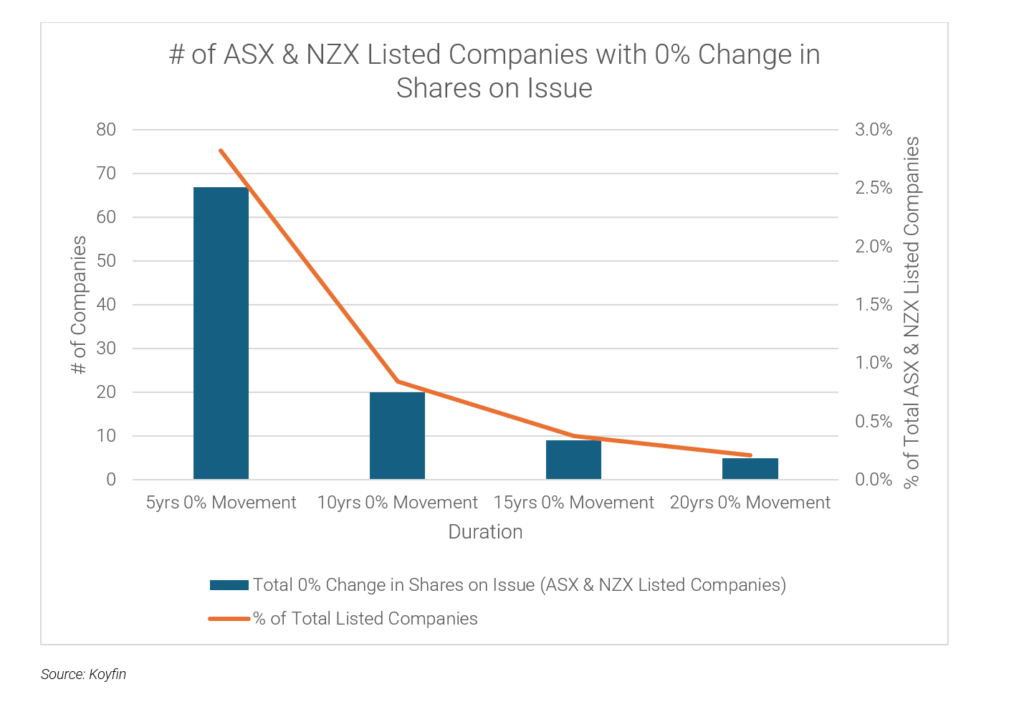
In a book we recently read about the Nomad Investment Partnership, which was run by a pair of modern investing greats, we learned they undertook an interesting stock screening exercise – looking for companies with absolutely no change in the number of shares on issue for the past ~20 years.
A business with a stable number of shares on issue over such a long period does not rely on equity raisings to fund growth; has a sustainable business which can fund growth through free cash flow, and does not undertake buybacks, dividend reinvestment programs or operate employee equity schemes which involve share issuances.
We thought this was an interesting screen to apply to stocks closer to home. As shown in the chart below, whilst ~2.8% of ASX/NZX listed companies haven’t changed their number of shares on issue over a 5-year duration, it was very rare for a company to not have changed its number of shares on issue over 20 years.
Gold Standard Remuneration
While what is considered to be best-practice remuneration may vary and be somewhat subjective, we consider the approach of Canadian software serial acquirer Constellation Software Inc. (TSX: CSU) to be the gold standard – one that others should look to emulate.
As a brief introduction to CSU – it was founded by the legendary Mark Leonard in 1995 and listed in 2006. Fast forward to today and the company has a market cap of CAD~$100bn. Put simply, it has been one of the most successful listed companies over the past 20 years.
CSU is a serial acquirer of vertical market software companies. Many companies undertake a systematic approach to bolt-on acquisitions. Why then has CSU been so successful where others have not? Whilst there are many reasons why this is the case, in our view, the two most crucial factors are because of CSU’s company culture and its employee remuneration plan (arguably both of these are linked).
CSU employees who are eligible to participate in the company’s bonus plan are paid an annual dollar figure based on the difference between the company’s return on capital and the company’s cost of capital. The bigger the positive delta, (i.e. the greater the return on capital vs. the cost of capital) the larger the bonus. Conversely, if the return on capital is lower than the company’s cost of capital, then CSU employees do not receive a bonus.
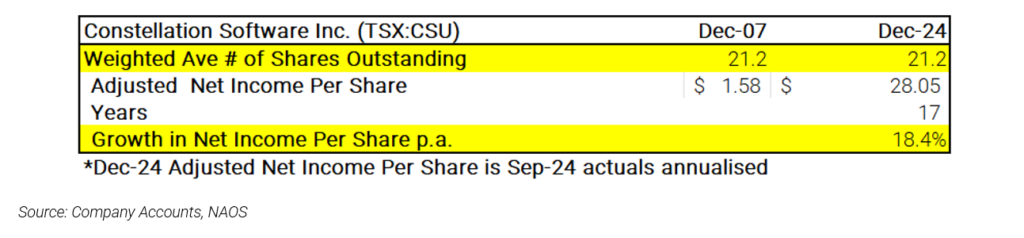
Assuming a bonus threshold is achieved, the bonus remuneration structure requires that all employees who reach a threshold level of compensation invest a portion (between 25% and 75% depending on numerous factors) of their bonus back into CSU stock that vests over generally four years. Critically, this stock is purchased in the open market from the pool of existing shares on issue, NOT through the issuance of new shares. This bonus remuneration structure therefore aligns employees with shareholders without dilution to shareholders. The below table outlines the financial track record of CSU between 2007 and 2024. As you can see, CSU’s shares on issue have remained the same since 2007 whilst net income per share has grown a remarkable ~18.4%p.a. The proof is in the pudding, this strategy appears to have been a fantastic one for those involved thus far.
What If Analysis?
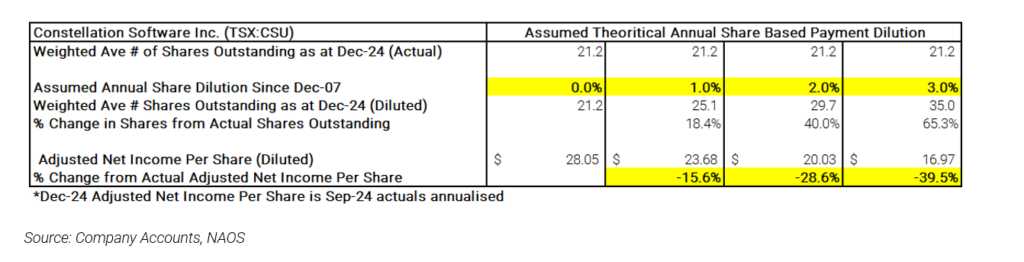
As shown in the table below, we undertook a theoretical exercise of looking at CSU assuming they had followed the common practice of issuing NEW shares for their bonus plan, at different levels of annual dilution (between 1-3%). If an incremental 1% of shares were issued every year since 2007, this would have resulted in a ~15.6% reduction in the per-share net income of the company. At a level of 3% p.a. dilution, this would have equated to a remarkable ~39.5% reduction in CSU’s per-share net income.
From Little Things Big Things Grow
One could argue that SBPs facilitate a transfer of value from companies and their shareholders to the employees of that company. In many instances, this value transfer is justified, as without employees there is no company. However, it may swing too far in the favour of employees at the financial expense of shareholders.
On the topic of compounding, we’re reminded of the song lyrics ‘From Little Things Big Things Grow’. Compounding can have wonderful effects on equities, but the laws of compounding can also work against you. A little bit of dilution each year can accumulate to a big number over time.
The NAOS Perspective
Employee remuneration in the form of SBPs has its place but it needs to be done in a responsible manner. We would encourage the Boards of any ASX company to look to the best examples, such as CSU, for guidance.
Equally, we would encourage investors to think about SBPs as a real expense, not just something that is ‘non-cash’ in nature. After all, it might not be visible at the EBITDA or the operating cash flow level, but on a per-share basis, it has the potential to be a silent diluter if you are investing for the long term.
At NAOS, we strive to practise what we preach. With respect to our Listed Investment Companies (LICs) we adopt a capital management approach that ensures if our LICs are trading at a discount to their Net Tangible Asset (NTA) value, any shares issued under our dividend reinvestment plans are acquired on market rather than through the issuance of new shares. We believe this strategy helps prevent the dilution of our shareholders at prices below the NTA.
Important Information: This material has been prepared by NAOS Asset Management Limited (ABN 23 107 624 126, AFSL 273529 and is provided for general information purposes only and must not be construed as investment advice. It does not take into account the investment objectives, financial situation or needs of any particular investor. Before making an investment decision, investors should consider obtaining professional investment advice that is tailored to their specific circumstances.
 (2)")
 (13)")
 (2)")
