 and Exchange Traded Funds (ETFs)")
 and Exchange Traded Funds (ETFs)")
 and Exchange Traded Funds (ETFs)")


By guest contributor, Ian Irvine, Chief Executive Officer, Listed Investment Companies and Trust Association.
26 August 2022
Briefly, by way of background, Listed Investment Companies (LICs) have been available to Australian investors for close to 100 years.
The longest continuously running LIC, Whitefield Limited (ASX: WHF) will celebrate its centenary in March 2023.
Exchange Traded Funds (ETFs), on the other hand have been available for just over 20 years, coming to the Australian market in 2001.
The SPDR S&P/ASX 200 Fund (ASX: STW) was one of the first to be admitted to ASX. It will turn 21 at the end of August 2022.
Are LICs and ETFs the same or similar?
Both LICs and ETFs are diversified investment vehicles, holding a range of underlying investments, such as Australian or global shares, infrastructure, fixed income or alternatives assets.
These are held as underlying investments within the LIC or ETF structure. However, while LICs and ETFs may be available over similar investment asset classes they are completely different on many fronts.
What are the key difference between LICs and ETFs?
Structure
The primary difference is that an LIC is a closed-end investment vehicles. Like other shares, such as BHP or CBA for example, capital raisings are administered and invested in a single, compact block, such as an Initial Public Offer (IPO) and as needed in future by way of means, such as rights and entitlements issues, security purchase plans (SPPs) and dividend reinvestment plans (DRPs). This provides a stable capital base for investment managers.
The stability of capital provided by a LIC encourages a long-term mindset at both management and investor levels, and supports the development of long-term investment thinking and the ability to implement strategies rewarding investors over time.
The structure of an ETF is similar to that of an unlisted managed fund or unit trust. It is an open-ended investment vehicle. In contrast to an LIC, open-end funds continuously receive applications from investors to either invest or to redeem an existing investment.
Where there are more investors seeking to invest than redeem, the ETF will buy more of the underlying investment held. If more wish to redeem that buy, the ETF may need to sell underlying investments to meet demand for cash.
This flow of capital in or out of an open-ended ETF can see investment managers buying into rising and possibly over-heated markets where demand for new units is high or selling into falling and undervalued markets where redemptions demand is high; making it difficult to implement long-term investment thinking and strategies.
Style –passive or active
The first ETFs introduced to Australia tracked an index such as the S&P/ASX 200 equity index as does the SPDR example above. This is referred to as passive investing; there is no investment strategy apart from replicating the performance and returns of the index being passively tracked.
The vast majority of ETFs available in Australia today by both number and value (see chart 2 below) passively track an index of sorts, be it the top 50, 100, 200 or 300 Australian shares, a sector such as financials or fixed income bond indices.
LICs on the other hand are actively managed. This means that an LIC investment manager knowing they have a stable capital base can buy, hold or sell underlying investments at their discretion to assist in meeting their investment objectives.
While they may measure their performance against a benchmark such as the ones above, they do not have to buy or sell to match an index.
So too, they do not need to sell underlying assets to meet investor redemptions or to buy more if investors wish to invest. This is undertaken by trading between other investors on ASX; setting a price to buy or sell on-market with other investors.
While ETFs are traded on ASX, in a way that may appear similar to a trade of a share or LIC, the trade is usually with a market maker acting on behalf of the ETF manager, creating new units to meet growing demand or cancelling redeemed units if demand falls.
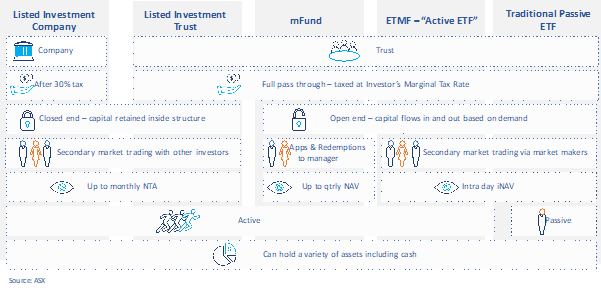
The chart 1. above outlines the range of investment structures available on ASX along with some of their characteristics. It introduces Listed Investment Trusts (LITs), which are similar to LICs, being closed-end structures, but having some of the features of open-ended trusts such as ETFs.
It also shows mFunds, which are managed funds available through ASX and ETMFs or Active ETFs.
Cost
When making a decision, to invest in a managed investment, such as an LIC or ETF, the cost of running the investment is an important consideration. It’s also important to not make an investment decision on cost alone.
As ETFs are predominantly passive in nature, they can be managed for a low cost as there is no active investment management or decisions to be made; they passively track an index.
Active management on the other hand does require considered decision making.
With a closed-end LIC, investment managers can be patient, as there is no urgency to buy or sell investments to meet investor demand. In the case of many LICs which have been well established for many years with solid management practices, the cost of running a large LIC can be very low.
In recent years, the introduction of Active ETFs has seen a shift in costs as active strategies run under these structures do not simply tracking an index.
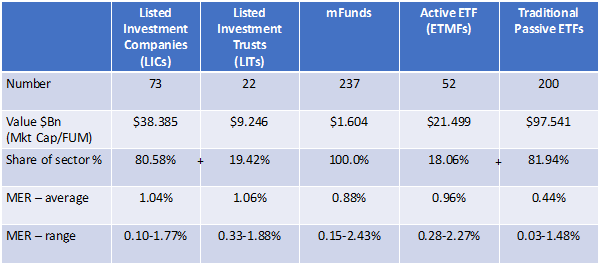
The chart 2. below looks at some of the market statics that make up the ASX Investment Product range, include product numbers, value and costs expressed as Management Expense Ratios (MERs). In this regard, its important not to look at averages but the range to find an appropriate investment.
It is as at end June 2022.
Concertation of asset classes in top 200 ASX stocks
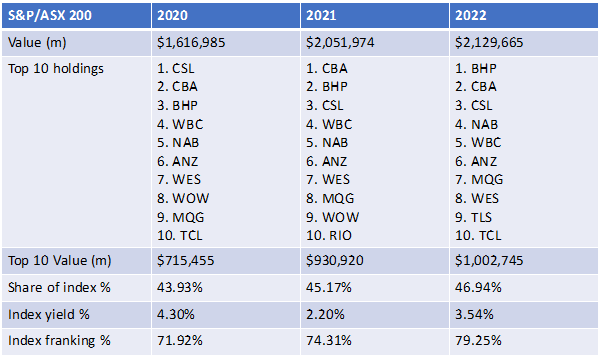
Chart 3. below shows the top 10 stocks at the head of the S&P/ASX 200 index. These ten stocks accounted for just under 47% of the value of the full 200 stocks in the index as at the end of June 2022.
BHP has been the big mover in the last 2 years following its unification in early 2022 making ASX its sole listing venue globally. It has moved from around 6% of the index to approximately 10%.
ETFs tracking this index are exposed to this concertation of a single stock as well as a collection of banks, which when combined make up 6 of the ten top stocks, while active LIC managers have the discretion to choose to hold which stocks and in what proportion.
Compare and contrast – LICs and ETFs
Chart 4. below takes a look at the largest LIC, AFI and its ETF counterpart, VAS. Each has a market cap (LIC) and FUM (ETF) of around $10-11 billion.
AFI is actively managing a portfolio of Australian shares for around 0.14% pa, while VAS is tracking the S&P/ASX 300 index of Australian share for around 0.10%pa.
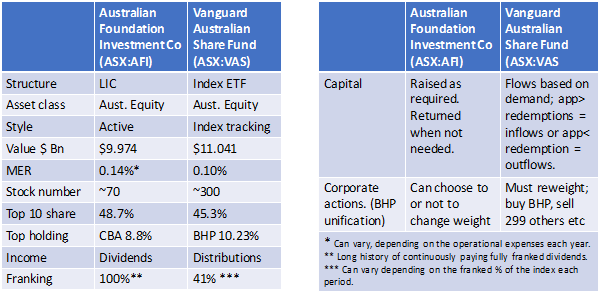
The chart also highlights how income is paid; dividends (LICs) and distributions (ETFs). In the case of AFI, it has continuously paid franked dividends and VAS passes through dividends and franking collected from the underlying holdings.
It is generally not a fully franked dividend as not all of the 300 underlying securities held pay a dividend, let alone a franked dividend.
Taxation and accounting
Regarding dividends and distributions, LICs due to their closed-end company structure can retain profits from previous periods and pay it as a dividend along with franking credits in future periods.
In this way income received by investors can be streamed over future periods and have provided investors with income during the exceptionally low interest rate environment of past decade. LIC dividends are paid after tax, like other listed companies.
Trusts, be they closed-end LITs or open-end ETFs must pay out all the income received in a year. This can include income from the underlying securities held along with any pass through franking credits, capital gains or losses.
ETF distributions are paid untaxed in the hand of investors, with any tax liability to be paid at tax time.
It is worthwhile remembering that a grossed up fully franked dividend of $1.00 is worth $1.43, where the company tax rate is 30% ($1.00 in cash + $0.43 franking credit for tax paid).
Depending on the investors’ own tax circumstance, they may receive a refund of the tax paid. This may be particularly so for SMSFs where members are in pension phase.
Summary
While on the surface, it may appear that LICs and ETFs are similar investment structures or similar ways of gaining access to investment assets, it is important to remember they are different structures and as such can provide different outcome for investors; both positive and negative.
When investing, its best to go into an investment with eyes open, understanding what the outcome may be rather than find out by accident at the wrong time.


